 agp.cooper
Goertzel's Algorithm
This algorithm can be used to detect a frequency from sampled data.
Here is a link (http://www.mstarlabs.com/dsp/goertzel/goertzel.html).
Here is the preliminary code for a spectrum analyzer:
#include <stdio.h>
#include <stdlib.h>
#include <math.h>
// Uses Daniil Guitelson's BGI library
#include "graphics.h" // -lBGI -lgdi32


#define SampleFreq 125000


int main(void)
{
  int N=250;
  double data[N];
  double samples[N];
  double freq;
  double s;
  double s_prev;
  double s_prev2;
  double coeff;
  double magn;
  int i;


  int gd=CUSTOM, gm=CUSTOM_MODE(700,700);
  initgraph(&gd, &gm, "");
  setcolor(WHITE);


  int X1,Y1,X2,Y2;
  double scale,xmin,ymin,xmax,ymax;


  // Find the maximum and minimum data range
  xmin=0;
  ymin=0;
  xmax=50000;
  ymax=N;
  scale=1.1*(xmax-xmin>ymax-ymin?xmax-xmin:ymax-ymin);


  // Generate samples
  for (i=0;i<N;i++) {
    samples[i]=(50*sin(2*M_PI*i*3300/SampleFreq)+50*sin(2*M_PI*i*5700/SampleFreq)+50*sin(2*M_PI*i*25700/SampleFreq)+100);
    // Window the data
    // data[i]=samples[i]; // Straight Goertzel - not great
    // data[i]=samples[i]*(0.5-0.25*cos(2*M_PI*i/N)); // Hanning Window
    data[i]=samples[i]*(0.54-0.46*cos(2*M_PI*i/N)); // Hamming Window
    // data[i]=samples[i]*(0.426551-0.496561*cos(2*M_PI*i/N)+0.076848*cos(4*M_PI*i/N)); // Exact Blackman Window
  }


  // Scan frequencies
  for (freq=100;freq<=50000;freq+=100) {
    coeff=2*cos(2*M_PI*freq/SampleFreq);
    s_prev=0.0;
    s_prev2=0.0;
    for (i=0;i<N;i++) {
      // Goertzel
      s=data[i]+coeff*s_prev-s_prev2;
      s_prev2=s_prev;
      s_prev=s;


    }


    // Get magnitude
    magn=2*sqrt(s_prev2*s_prev2+s_prev*s_prev-coeff*s_prev*s_prev2)/N;
    printf("Freq: %6f Mag: %6.4f\n",freq,magn);


    // Plot data
    X1=(int)((freq-(xmin+xmax)/2)*700/scale+350);
    Y1=(int)((0+(ymin+ymax)/2)*700/scale+650);
    X2=(int)((freq-(xmin+xmax)/2)*700/scale+350);
    Y2=(int)((-magn*700/2+(ymin+ymax)/2)*700/scale+650);
    line(X1,Y1,X2,Y2);


  }
  getchar();
  closegraph();


  return 0;
}
I have used Daniil Guitelson's BGI library (https://sourceforge.net/projects/openbgi/) for the graphics.
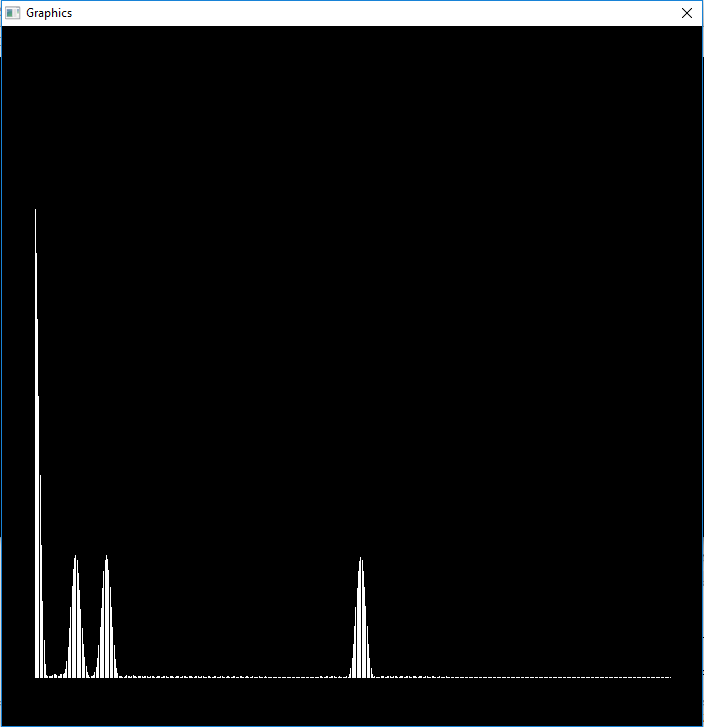
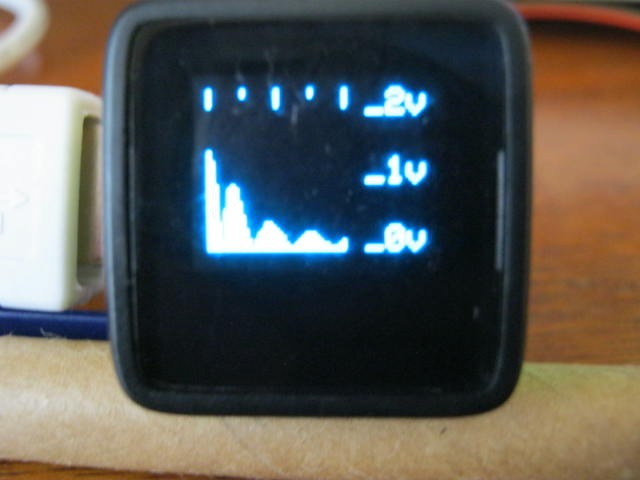
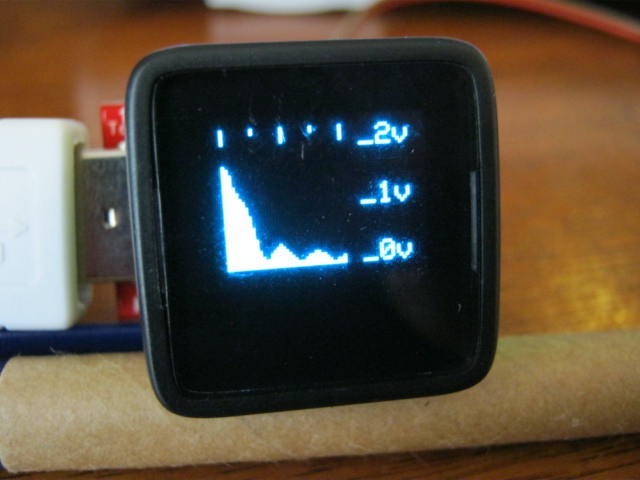
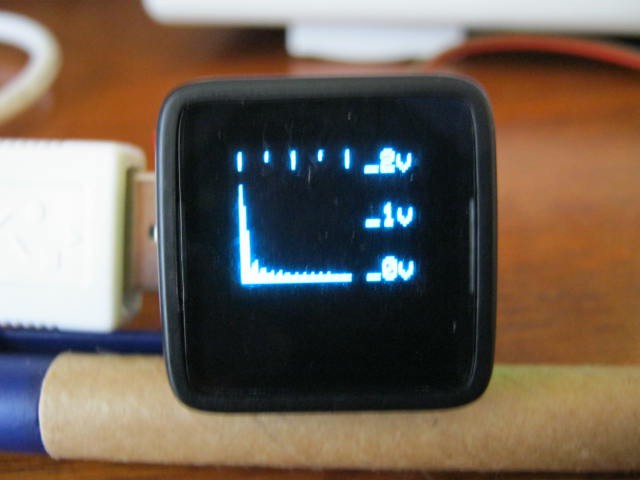
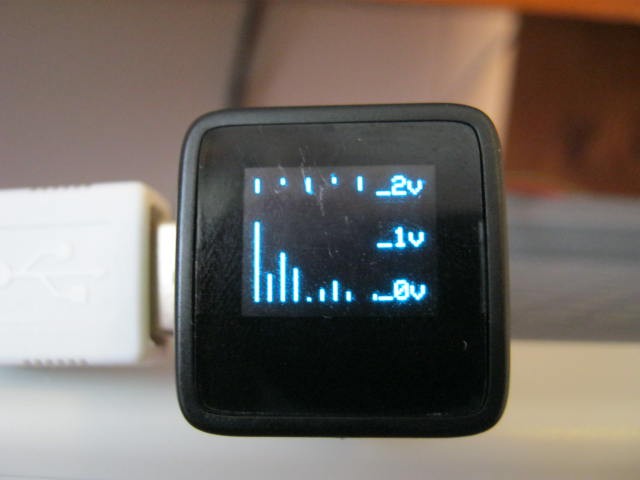
Output
Here is the output showing the DC, 3300 Hz, 5700 Hz and 25700 Hz signals:
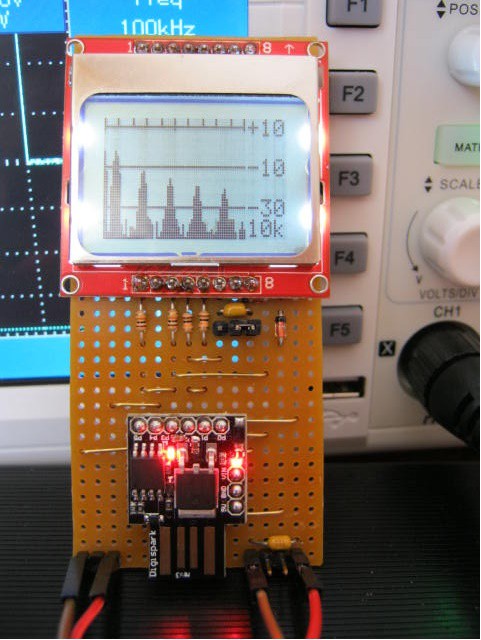
Next Step
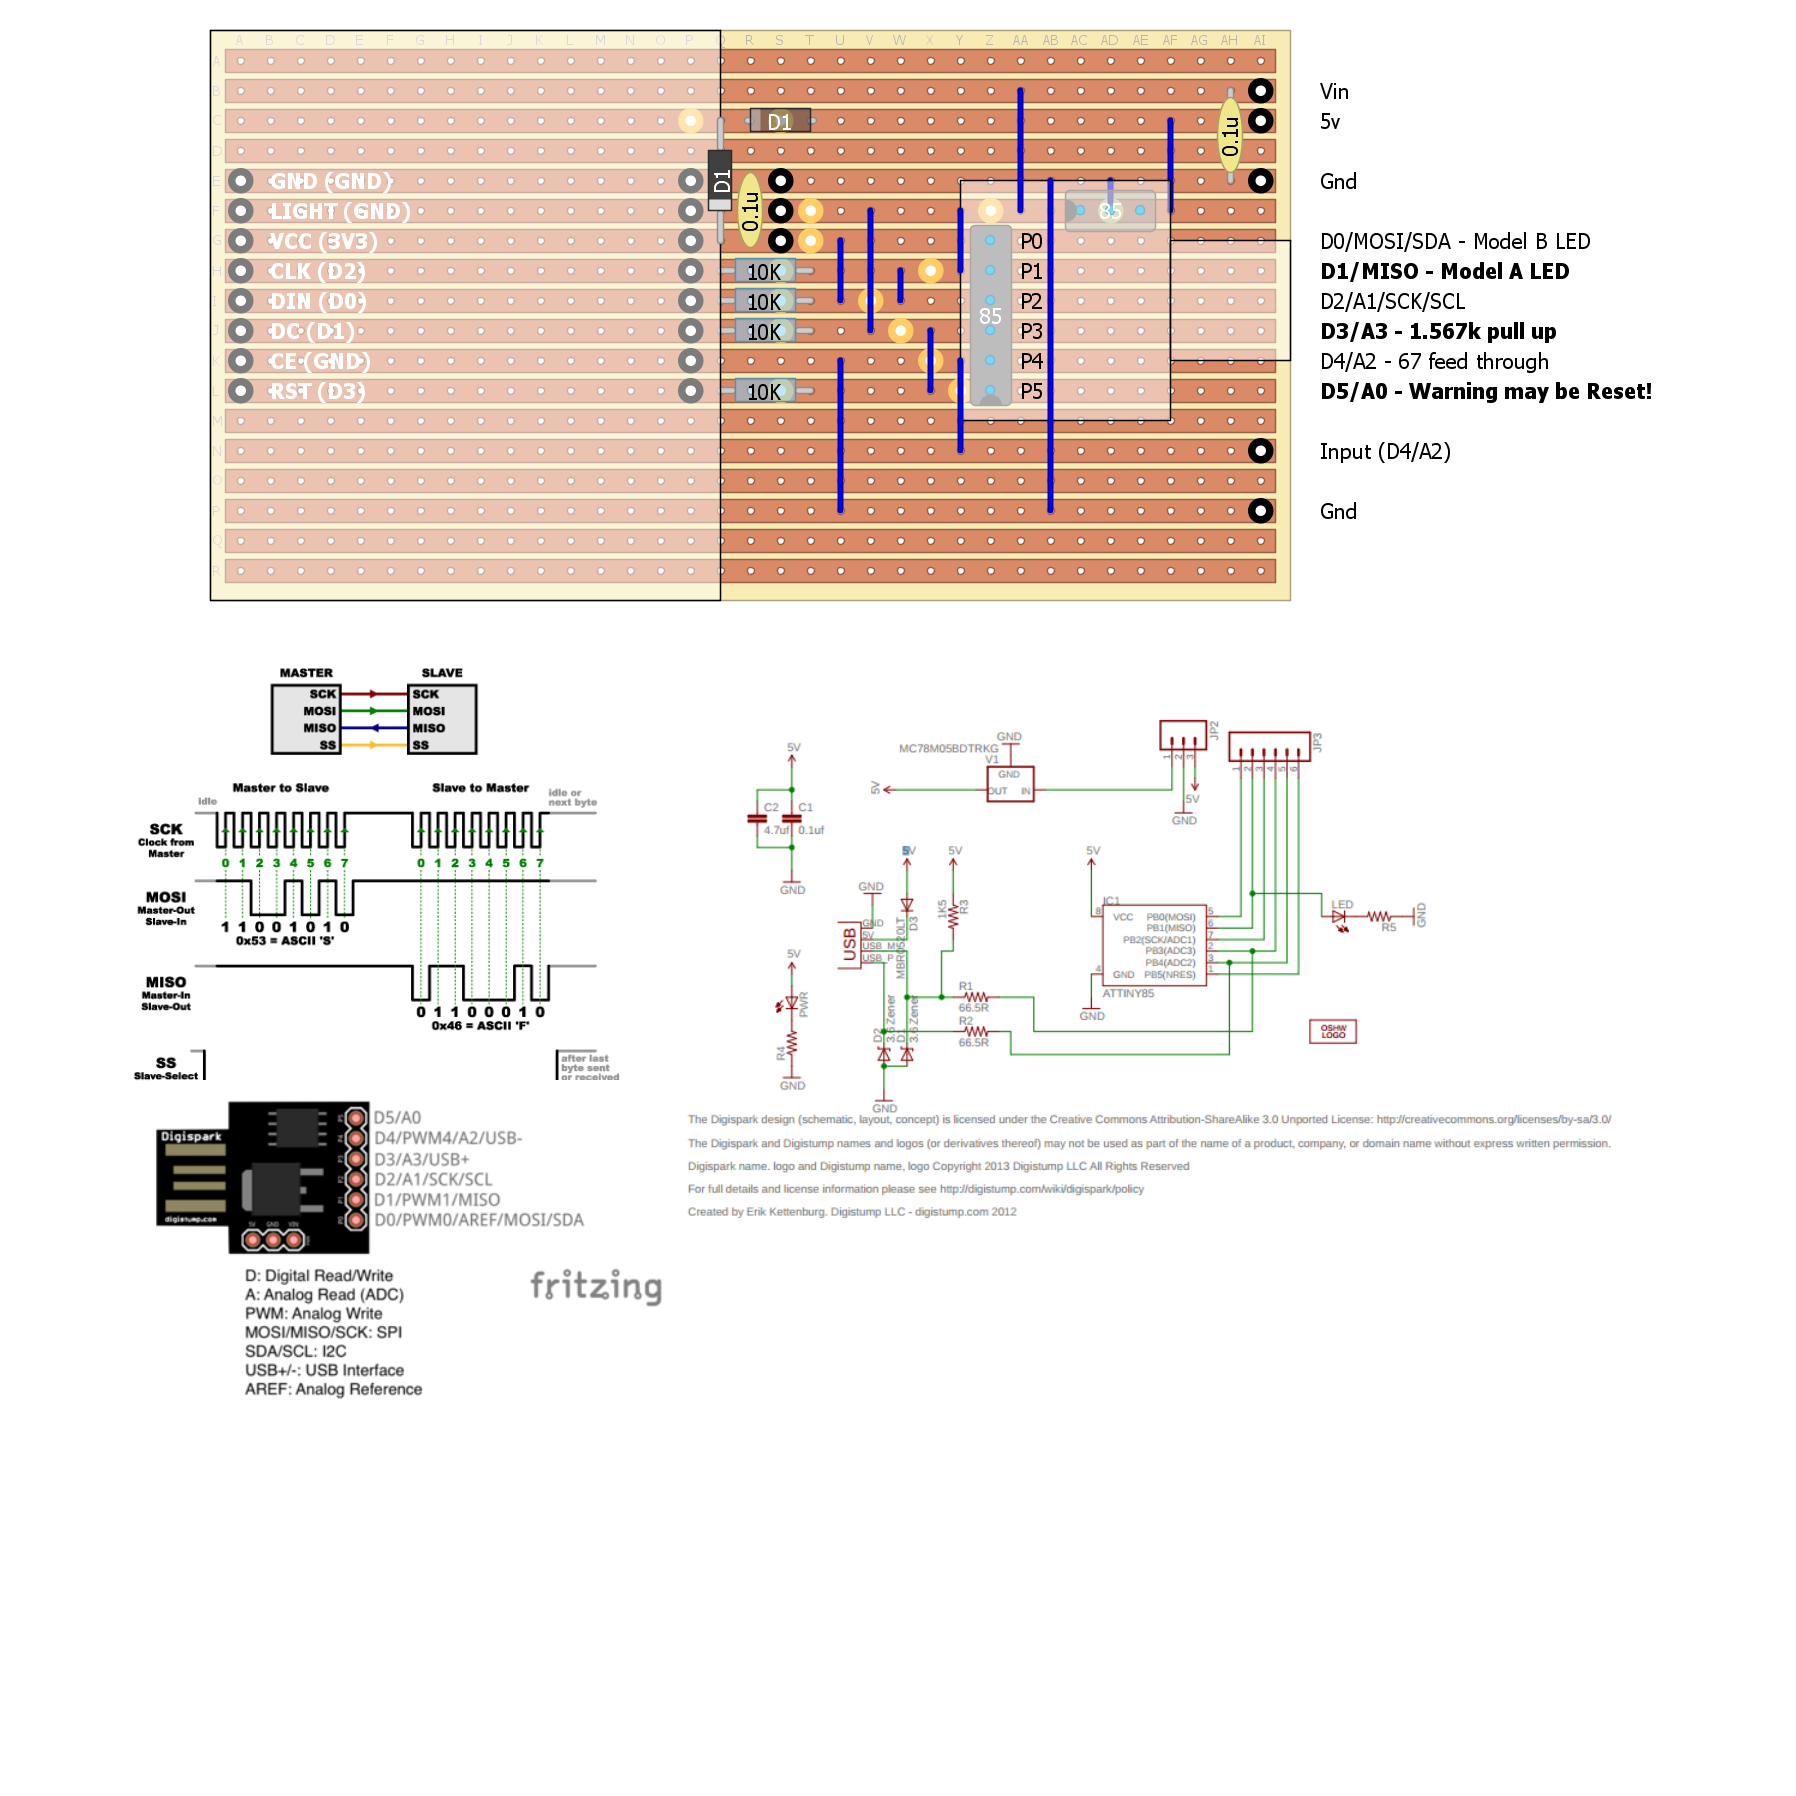
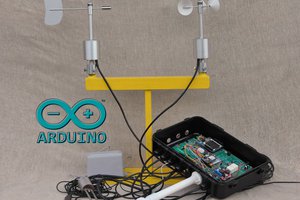
The next step is to port the code to a suitable Arduino board.
I have a number of DigiSpark (ATTiny85) boards and Nokia graphic displays.
So that is what I will likely use.
The ATTiny85 has an ADC sampling rate of 125 kHz.
A high ADC sampling rate is important.
AlanX


 GOAT INDUSTRIES
 Edgar
Edgar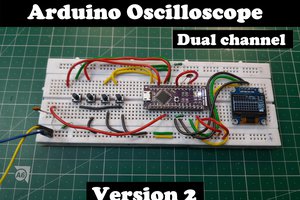
 Sagar 001
Hi Elliot,
I told my partner that someone thought my Spectrum Analyser was sexy!
She was horrified and responded "another madman".
Regards AlanX